
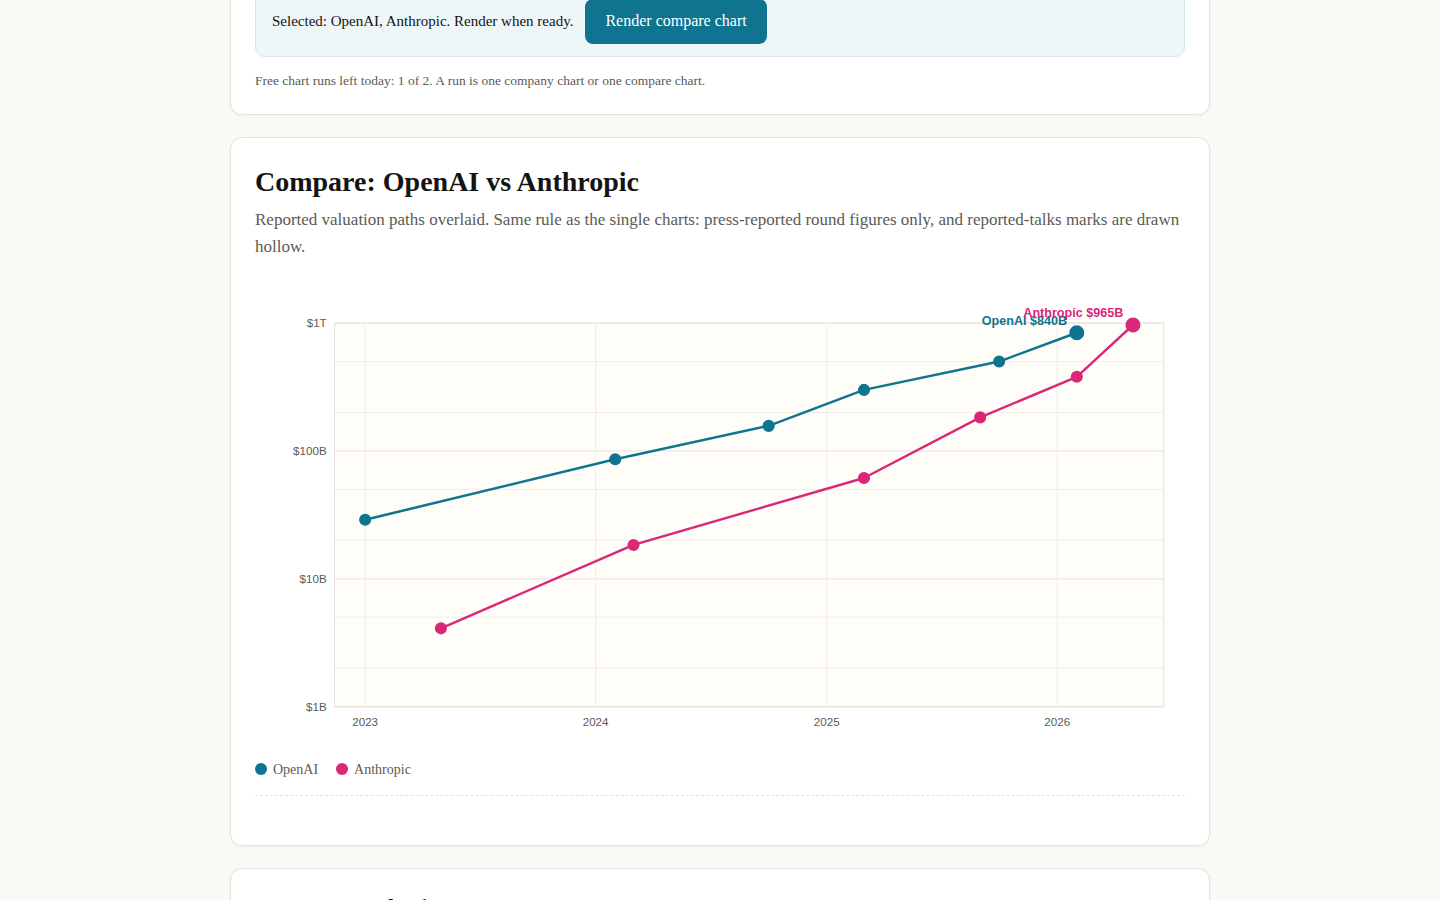
Search for Anthropic in a stock app and, until its IPO prices, you still get nothing: no ticker, no chart. In Tickers for the Tickerless it has the steepest chart on the board: six reported valuation points between May 2023 and May 2026, from $4.1B to $965B, each with its round, its date and its source attached. Here is how to read it, using only what the tool shows. The short explainer covers how the board works; this post is the Anthropic line itself.
1. What a point on this chart is
A point is a post-money valuation reported at a named funding round on a specific date. It is a negotiated price between the company and the investors in that round, reported by a named source, and it is neither a market price nor an official disclosure: private companies file no valuation with anyone. The tool keeps four kinds of points apart (primary rounds, tender offers, secondary sales and reported talks, the last drawn hollow and never counted as closed). All six of Anthropic's points are primary rounds. The line joining them is a drawing aid; the points are the data, and between two points the chart knows nothing.
2. The six marks, in order
May 2023, Series C, $4.1B. Anthropic did not disclose a Series C valuation; $4.1B is the figure reported by CNBC and The Information. March 2024, the Amazon strategic investment, $18.4B, as reported by Bloomberg. March 2025, Series E, $61.5B, announced by Anthropic itself. September 2025, Series F, $183B, announced by Anthropic. February 2026, Series G, $380B, announced by Anthropic. May 2026, Series H, $965B, as reported by Bloomberg, and labelled in the tool as the company's last private mark.
Read the spacing, not just the sizes. The first three points span almost two years; the last three arrive inside eight months, $183B, $380B and $965B between September 2025 and May 2026. End to end, the reported mark multiplied about 235 times in three years. The latest step, Series G to Series H, is 2.54x. The biggest single step is the first one: 4.49x, from the Series C to the Amazon strategic investment.
3. The revenue line changed its source
Under the valuation line the tool plots revenue as a separate diamond series, and Anthropic's is the only one on the board whose source class changed mid-chart. It used to be press-reported run rates, like every other company's. Since the S-1 filing it is actuals: $4,585M of revenue for the full year 2025 and $16,286M for the first half of 2026, both as filed in the registration statement (SEC EDGAR accession 0001628280-26-067168), plus one more diamond, $16.8B for the third quarter of 2026, which is company-reported to investors and labelled as such, because the filing's statements end on June 30, 2026. The valuation series could not make the same move: no filing prices a private round, so the six marks stay reported, and the chart now carries one series you can audit in a filing and one you cannot. Our figure-by-figure reading of the S-1 works through what else the filing put on the record.
4. What the chart cannot say
Three limits, all printed on the tool's own page in plainer language. First, a round mark is a negotiated price on one day, not a continuous price: nothing between May 2023 and March 2024 is measured, and the straight line across that gap is not evidence. Second, the endpoint is aging: the Series H mark was set in May 2026, roughly half a year before this post, and a private mark does not drift with news the way a stock does; it just sits there until the next priced event. Third, a reported mark is only as strong as its sourcing, which is why the tool attaches a named source to every point and why this post has repeated them. None of this is investment advice, and the tool says so on its own page.
5. Where the chart goes next
The chart already carries the milestone: the tool annotates the S-1 filing of October 26, 2026 on Anthropic's series, with the reserved Nasdaq symbol ANT and the price range still pending. That annotation is not a seventh valuation point, and the tool does not draw one. The next real point will be set by the IPO pricing, and it will be a different kind of point: a market price, printed by a market, after which Anthropic leaves the board entirely, because it has a ticker and a different chart. Until then, the six marks above are the whole chart. Open the Anthropic chart in Tickers for the Tickerless and read them with their sources attached; two chart runs a day are free, and an email unlocks the charts for the rest of the day.
6. Method and sources
This post follows the rule set for this site: it uses only figures the tool itself shows. Every valuation above is a press-reported round mark from the Tickerless dataset, compiled in October 2026, with per-point sourcing recorded in the tool (CNBC and Bloomberg for the reported points, Anthropic's own announcements for Series E, F and G). The revenue figures are the exception the tool itself carries: actuals from Anthropic's S-1 filing on SEC EDGAR, plus the third quarter labelled company-reported. No figure from outside the tool, including any reported talk about what the IPO might value the company at, appears in this post.